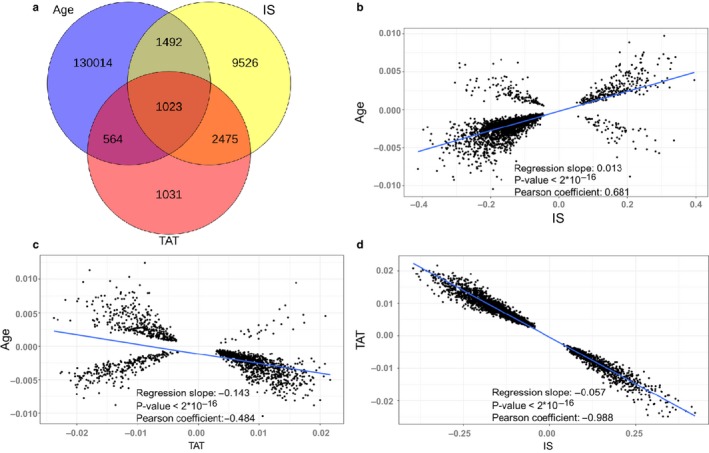
Figure 3.

Age‐related DNA methylation changes that characterize calorie restriction (CR). (a) Venn diagram of CpG sites that significantly change with age in the control group (Age), sites with the initial shift (IS) in response CR, and sites with cumulative changes following the intervention (TAT). (b) Correlation between linear model coefficients of significant age‐related changes in the control group and significant IS changes. (c) Correlation between linear model coefficients of significant age‐related changes in the control group and significant cumulative changes under the CR regime. (d) Correlation between the coefficients of significant cumulative changes and significant IS changes in response to CR (including, but not limited to sites with age‐related changes)
