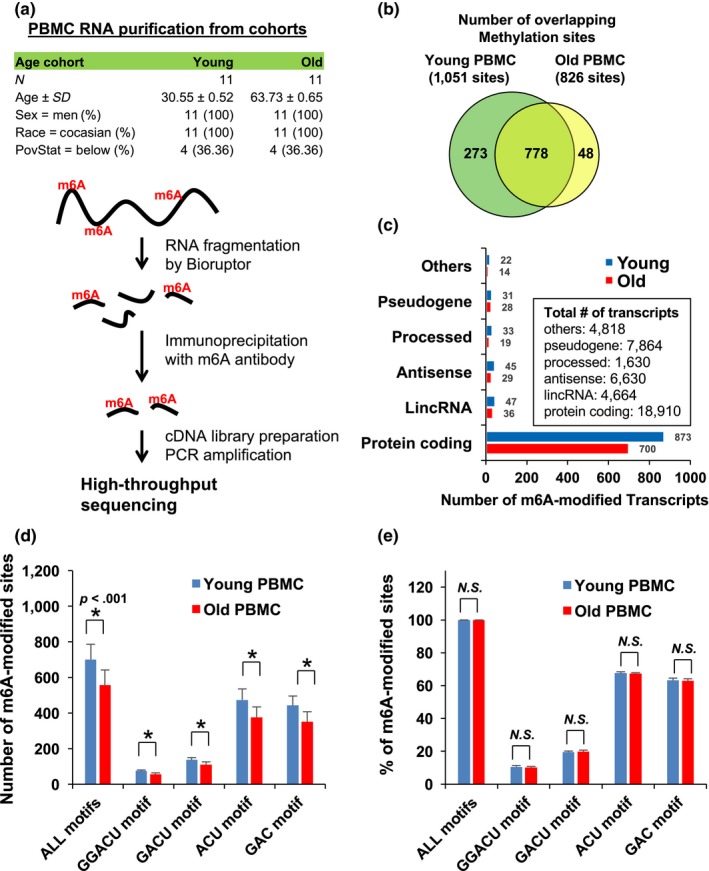
Figure 1.

m6A RNA sequencing in young and old PBMCs. (a) Schematic of m6A RNA sequencing with PBMCs from young and old cohorts (b) Number of overlapping m6A sites on young and old PBMC RNAs (c) Number of RNA methylation sites on each transcripts types (d and e) Number (D) and proportions (E) of m6A RNAs in young and old PBMCs. Data in D are statistically significant using Student's t‐test (p = .000044, .000015, .000028, .000083, or .000067, respectively)
