
Figure 1.
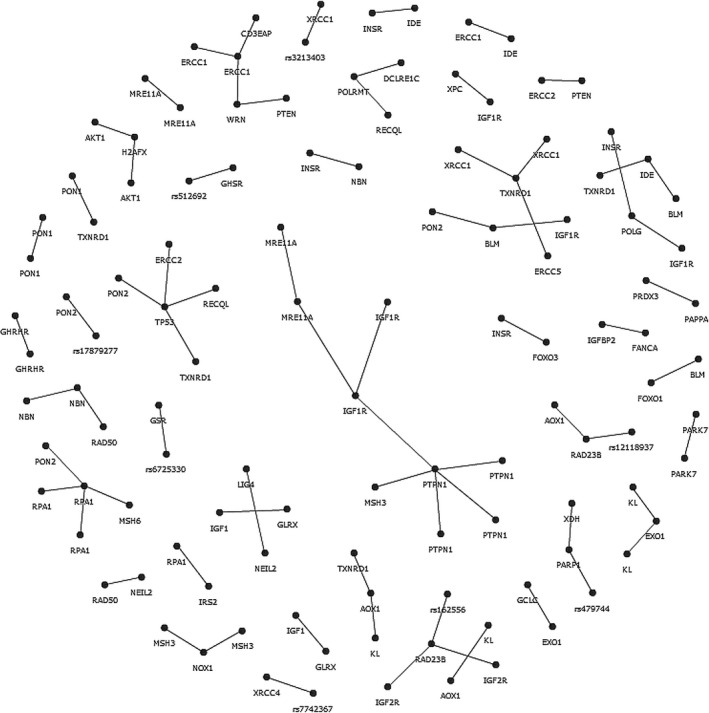
Interaction network obtained by the analysis of SNP‐SNP interactions by SNPsyn in the whole data set, comprising the all three analysed pathways (IIS, DNA repair and pro‐antioxidant). Each dot represents a SNP, indicated by the corresponding gene, when univocally assigned or by dbSNP notation, when present in a regulatory region, and not assigned by the SNPsyn output