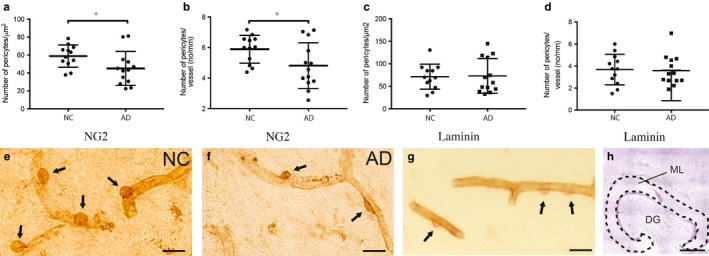
Figure 1.

Column scatter plots in (a and c) demonstrate decreased number of NG2+ pericytes/μm2 (a) and number of NG2+ pericytes/vessel length (b) in brains from patients with Alzheimer's disease (AD) compared to nondemented controls (NC). Column scatter plots in (c and d) demonstrate unaltered number of laminin+ pericytes/μm2 (c) and number of laminin+ pericytes/vessel length (d) in brains from patients with AD compared to NC. Data are analysed using Student's t‐test, results are presented as means ± standard deviations. Significant difference at *p < .05. Images in (e and f) show hippocampal pericytes stained against NG2 (indicated by arrows) in nondemented controls (NC) (e) and patients with Alzheimer's disease (AD) (f). Image in (g) shows a representative staining against laminin, where pericytes are indicated by arrows. The area in which pericytes were counted, that is the molecular layer (ML) of hippocampus, is outlined in image (h). Scale bar (e–g) 20 μm. Scale bar (h) 1,000 μm
