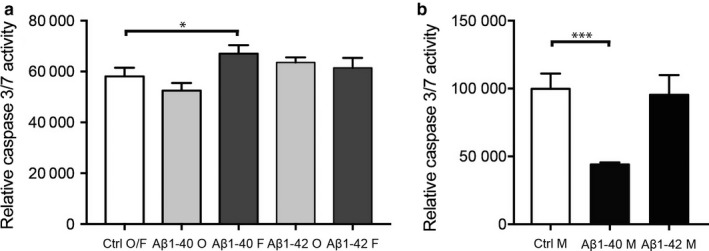
Figure 4.

Bar graphs demonstrating alterations in cytotoxicity, measured by caspase 3/7 activity, in HBVPs after exposure to 10 μm monomer, oligomer‐ or fibril‐EP Aβ1‐40 and Aβ1‐42 for 24 hr. Graph in (a) shows the significantly increased relative caspase 3/7 activity in HBVP after exposure of fibril‐EP of Aβ1‐40 compared to Ctrl O/F. Graph in (b) demonstrates the significant increased relative caspase 3/7 activity in HBVP after exposure to monomer Aβ1‐40 compared to Ctrl M. Data were analysed using one‐way analysis of variance (ANOVA), followed by Dunnett's post hoc correction (n = 4 comparisons) (oligomer‐ and fibril‐EP of Aβ1‐40 and Aβ1‐42) or Student's t‐test (monomer preparations of Aβ1‐40 and Aβ1‐42). Results are presented as means ± standard deviations. Significant difference at *p < .05 and ***p < .001
