Figure 5.

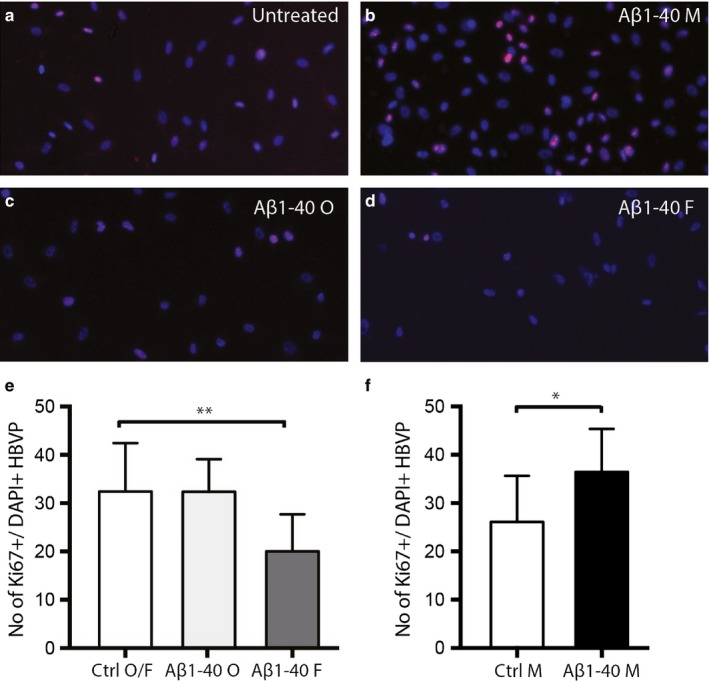
Bar graphs demonstrating alterations in Ki67+ cells, indicative of cell proliferation, in HBVPs after exposure to 10 μm monomer, oligomer‐ or fibril‐EP Aβ1‐40 for 24 hr. Image in (a) shows untreated HBVP stained against Ki67 and DAPI. Image in (b) demonstrates Aβ1‐40 monomer‐exposed HBVP stained against Ki67 and DAPI. Image in (c) demonstrates HBVP stained against Ki67 and DAPI after exposure to oligomer‐EP Aβ1‐40. Image in (d) shows fibril‐EP Aβ1‐40‐exposed HBVP stained against Ki67 and DAPI. Graph in e) shows the significantly decreased number of Ki67+ HBVPs after exposure of fibril‐EP of Aβ1‐40 compared to Ctrl O/F. Graph in (f) demonstrates the significantly increased number of Ki67+ HBVPs after exposure of monomer EP of Aβ1‐40 compared to Ctrl M. Data were analysed using one‐way analysis of variance (ANOVA), followed by Dunnett's post hoc correction (n = 2 comparisons) (oligomer‐ and fibril‐EP of Aβ1‐40) or Student t‐test (monomer preparations of Aβ1‐40). Results are presented as means ± standard deviations. Significant difference at *p < .05, **p < .01
