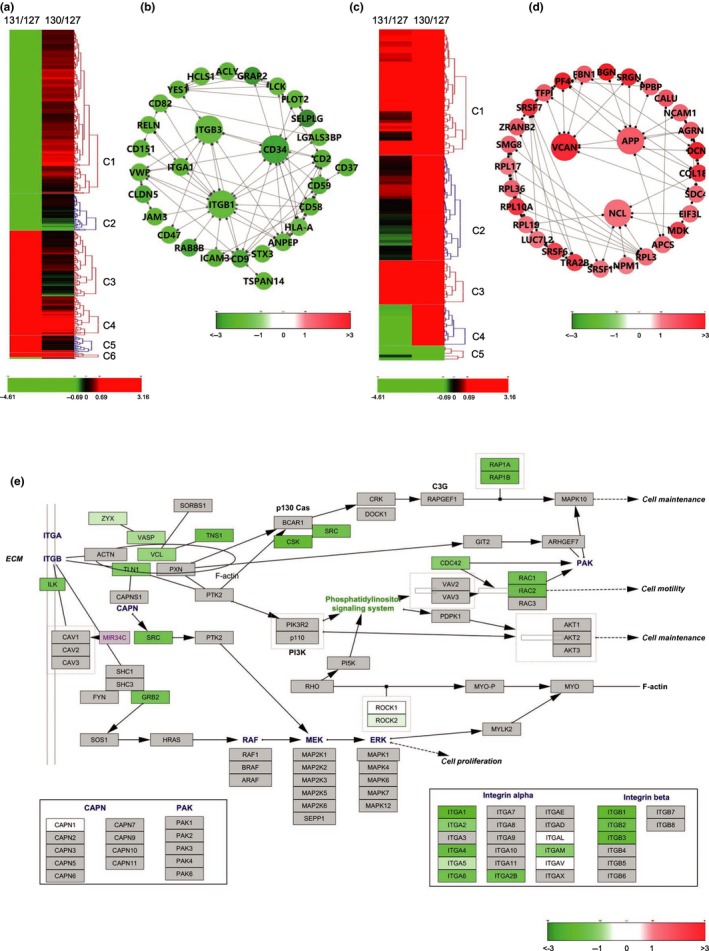
Figure 3.

Bioinformatics analysis of DEPs from SDEs based on STRING and Wiki pathway databases. The heatmap was constructed into clusters by Hierarchical Clustering Explorer 3.5 and shows contrasting or similar expression levels of osteoporosis‐associated SDE DEPs compared with those identified from SDEs of osteopenia patients (MS data presented as the ratios to 131/127 and 130/127 were input into Hierarchical Clustering Explorer 3.5 with Ln transformation). The DEPs in the protein–protein interaction networks are shown as nodes (MS data presented as the ratios to 131/127 and 130/127 were matched to STRING networks with log2 transformation). Up‐ or downregulation of identified proteins is indicated by colors either in the heatmap or networks (upregulated in red, downregulated in green). All identified proteins were mapped to the relevant Wiki pathway database. Proteins are represented by boxes labeled with the protein name. Relative protein expression level in SDEs of osteoporosis patients is indicated by colors (MS data presented as the ratios to 131/127 and 130/127 were matched to STRING networks with log2 transformation). Proteins in gray were not identified in this study. (a) Heatmap of DEPs of SDEs from patients with osteoporosis (131/127) comparing to those from patients with osteopenia (130/127). (b) Network of overall DEPs in SDEs of patients with osteoporosis. (c) Heatmap of DEPs of SDEs from patients with osteopenia (130/127) comparing to those from patients with osteopenia (131/127). (d) Network of upregulated proteins in SDEs of patients with osteopenia. (e) DEPs of SDEs from osteoporosis patients mapping to the Integrin‐mediated cell adhesion pathway. “C1‐6” refers to cluster 1‐6 in each heatmap
