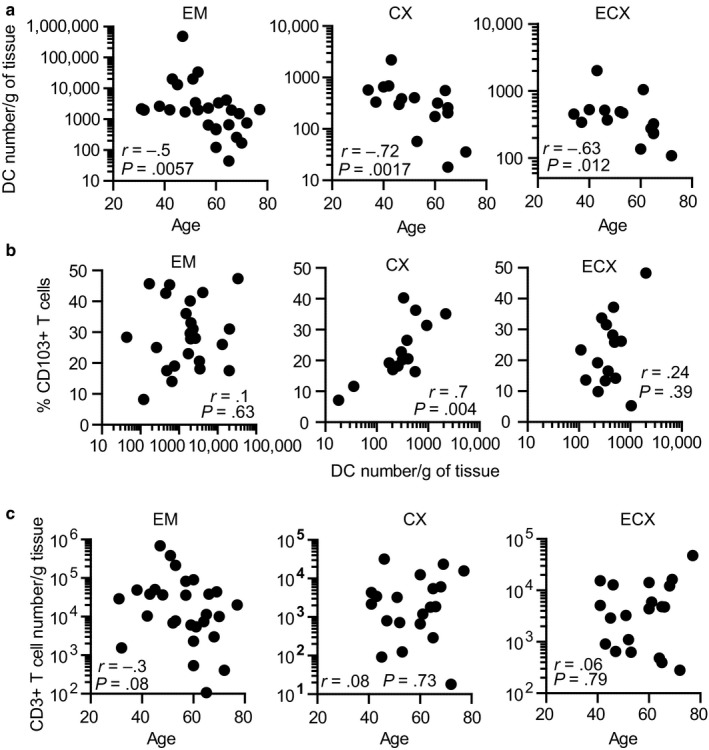
Figure 5.

Dendritic cells (DC) numbers and CD103+ T cell percentage decline in cervix with aging. (a) Correlation between DC number and age (EM = 27; CX = 16; ECX = 15) and (b) DC number and CD103+ T cell percentage (EM = 25; CX = 15; ECX = 15). (c) Correlation between age and total CD3+ T cells per gram of tissue (EM = 28, CX = 20, ECX = 20). Each dot represents a single patient; Spearman correlation
