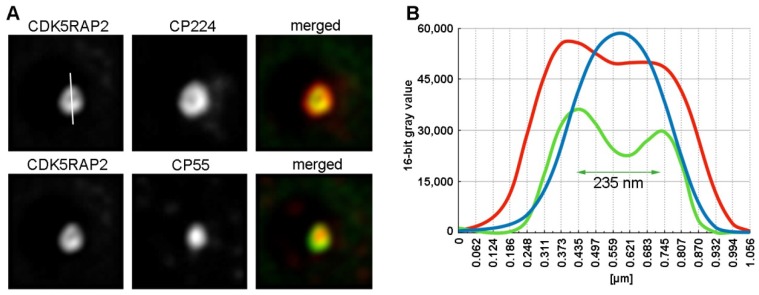
Figure 1.
Subcentrosomal distribution of CDK5RAP2. Immunofluorescence deconvolution microscopy of AX2 control cells with rabbit anti-CDK5RAP2, rat anti-CP55 and mouse anti-CP224. Secondary antibodies against rabbit, rat and mouse antibodies were conjugated with AlexaFluor 568, AlexaFluor 488, and Cy5, respectively and cells were fixed with methanol. (A) The same representative centrosome is shown in all three channels as indicated. (B) Shows the corresponding intensity distributions for CDK5RAP2 (green), CP55 (blue) and CP224 (red) along the line shown in the upper left of (A).

