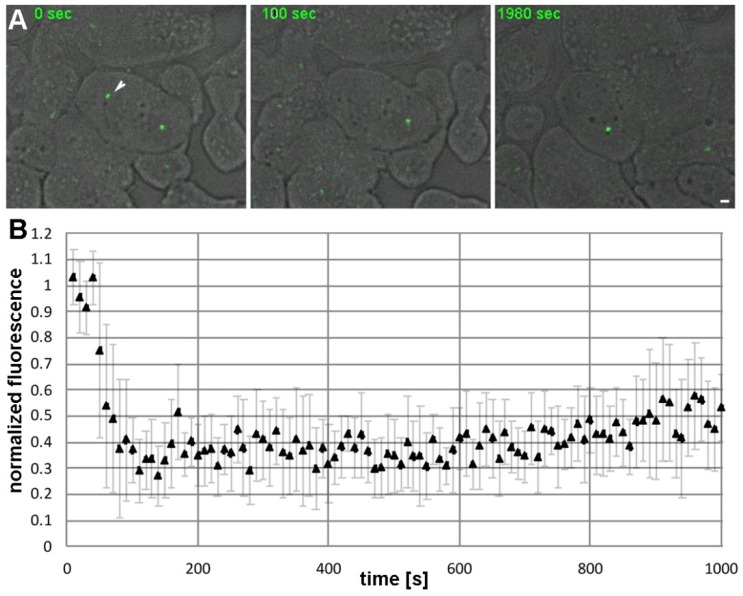
Figure 4.
GFP-CDK5RAP2ki shows hardly any recovery after photobleaching. (A) Confocal spinning disk live cell imaging of GFP-CDK5RAP2ki cells. Selected time points from Video S2 are displayed. A maximum intensity projection of three confocal slices (z-distance 0.25 µm) is shown. The bleached centrosome is highlighted by an arrowhead. Cells were viewed under agar overlay [35]. Bar = 2 µm. (B) FRAP curve mean intensity values and error bars indicating SD (n = 10) are plotted against time.

