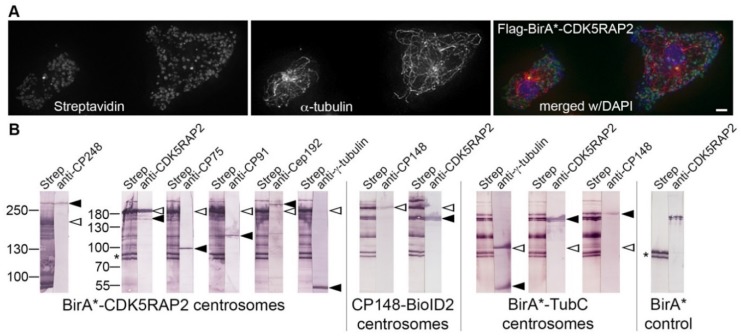
Figure 8.
Centrosomal interactions of biotinylase-tagged CDK5RAP2 in the BioID assay. (A) Immunofluorescence microscopy ofFlag-BirA-tagged CDK5RAP2RNAi cells stained with anti-α-tubulin and streptavidin-AlexaFluor 488. DNA staining with DAPI is shown in the merged image. The secondary antibody was anti-rat AlexaFluor 568. Cells were fixed with glutaraldehyde. Maximum intensity projections of deconvolved images are displayed. Bar = 2 µm. (B) BioID Western blot analysis according to [30]. Centrosome extracts prepared from the cell lines indicated at the bottom were electrophoresed and blotted. Single lanes were cut from broad blots, stained individually with streptavidin-alkaline phosphatase (strep) or antibodies as indicated on top, and re-aligned after staining as shown. Bands were visualized using conjugates with alkaline phosphatase and NBT/BCIP color detection. Positions of the respective fusion proteins always showing self-biotinylation are marked by open arrowheads. Positions of endogenous, biotinylated proteins are labeled by filled arrowheads. The position of the double band representing biotinylated mitochondrial proteins is highlighted by an asterisk.

