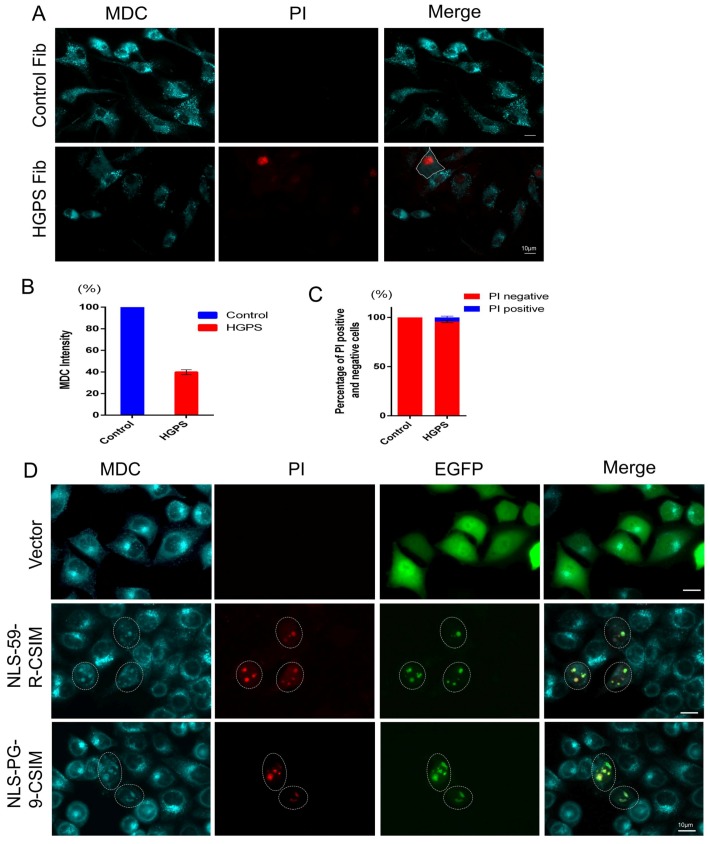
Figure 6.
Determination of autophagy activity. (A) Monodansylcadaverine (MDC) and propidium iodide (PI) staining were performed to detect the numbers of autophagosomes and dead cells in normal and HGPS fibroblasts. Representative images of cells are shown. HGPS cells exhibit heterogeneous brightness of MDC fluorescence intensity. A PI-positive cell with no detectable MDC signal is outlined; (B) The fluorescence intensity of MDC was measured in control and HGPS fibroblasts. Two hundred fifty-three control cells and 244 HGPS cells were counted. The average MDC fluorescence intensity was used for the statistical analysis; (C) The percentages of PI-positive cells were calculated by counting 317 control cells and 309 HGPS fibroblasts. All statistical analyses were performed using Student’s t-test. Two-tailed p-values were calculated and p < 0.05 was considered significant; (D) MDC and PI staining in EGFP vector-, EGFP–NLS-59-R-CSIM-, and EGFP–NLS-PG-9-CSIM-transfected cells. EGFP–NLS-59-R-CSIM- and EGFP–NLS-PG-9-CSIM-transfected cells showing colocalization of MDC with the EGFP signal at the NE invaginations are circled. Scale bar, 10 µm.

