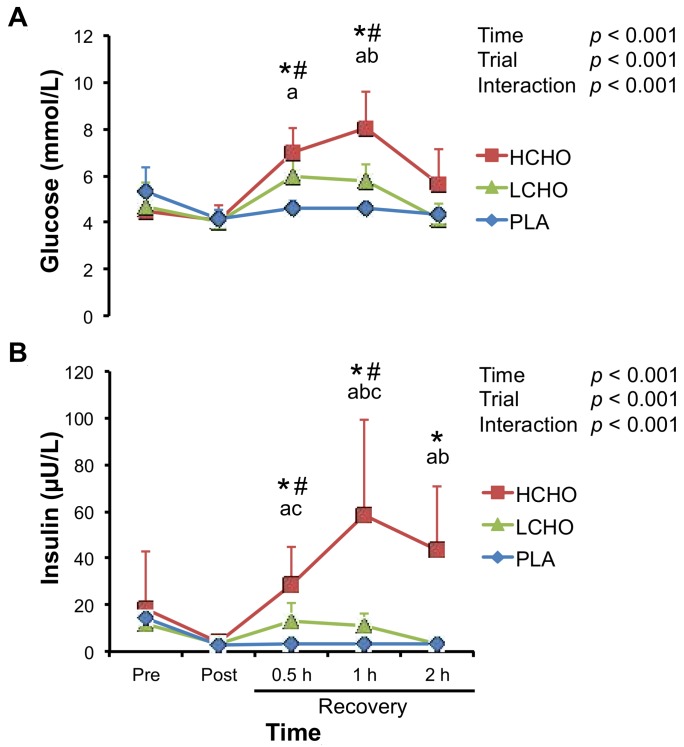
Figure 1.
Changes in plasma glucose (A) and serum insulin (B) concentrations in response to endurance exercise. HCHO, high-carbohydrate trial; LCHO, low-carbohydrate trial; PLA, placebo trial; Pre, pre-exercise; Post, immediately after exercise; 0.5 h, 0.5 h after exercise; 1 h, 1 h after exercise; 2 h, 2 h after exercise. * p < 0.05 vs. Pre for HCHO trial. # p < 0.05 vs. Pre for LCHO trial. a p < 0.05, HCHO vs. PLA. b p < 0.05, HCHO vs. LCHO. c p < 0.05, LCHO vs. PLA.

