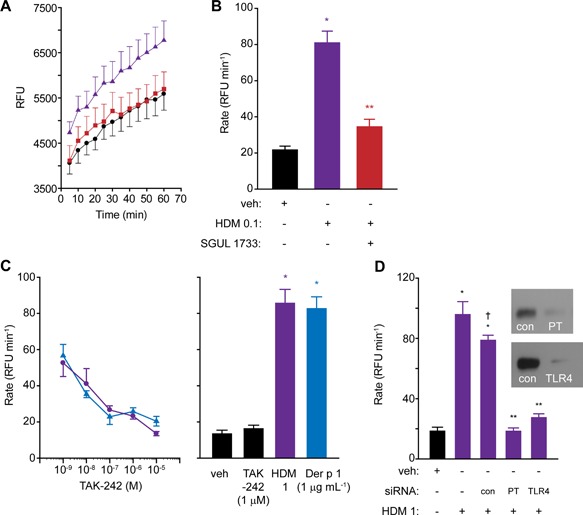
Figure 8.

(A and B) Generation of ROS in calu‐3 cells by HDM allergens and its inhibition by allergen delivery inhibitor SGUL 1733. Panel A shows progress curves for ROS production in vehicle‐treated cells (black circles), cells treated with HDM 0.1 (purple triangles) and HDM‐treated cells in the presence of SGUL 1733 (red squares). Panel B shows the corresponding initial rates of ROS formation (*P < 0.05 v veh, **P < 0.05 v HDM 0.1). Data from quadruplicate observations thrice replicated. (C) Inhibition of responses to mixed HDM allergens (purple circles) or purified Der p 1 (blue triangles) by TAK‐242. All drug effects are P < 0.05 v the relevant positive control. Baseline ROS production in the absence or presence of TAK‐242 are shown in the bar chart, together with the positive control responses for the stimuli (*P < 0.05 v negative controls). (D) Cell silencing of prothrombin (PT) or TLR4 inhibits the response to mixed HDM allergens (*P < 0.05 v vehicle (veh), **P < 0.05 v HDM 1 with or without control (con) transfection, † P < 0.05 v HDM 1 in non‐transfected cells).
