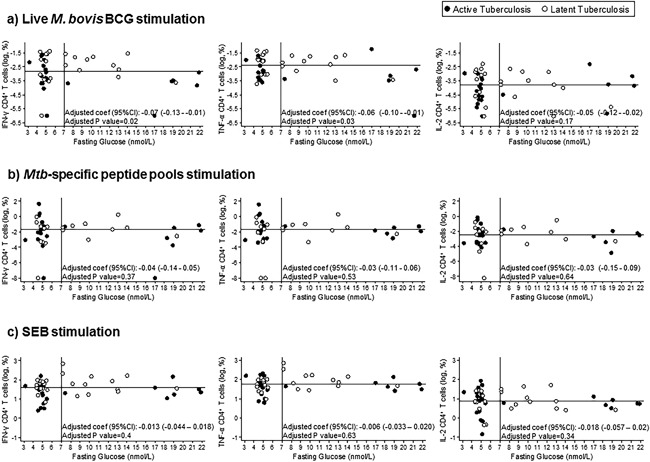
Figure 3.

Dot‐plot graphs of the frequencies of CD4+ T cells producing cytokines against fasting capillary glucose levels after: (a) live M. bovis BCG stimulation; (b) Mycobacterium tuberculosis‐specific peptide pool stimulation; (c) Staphylococcal enterotoxin B stimulation. Statistical analysis: Linear regression adjusted for age and sex. The horizontal line represents the median value of the logarithmic frequency of CD4+ T cells producing cytokines and the vertical line represents the fasting glucose level cut‐off for DM disease classification. Patients with active tuberculosis: n = 28. Patients with latent tuberculosis: n = 26.
