
Figure 2.
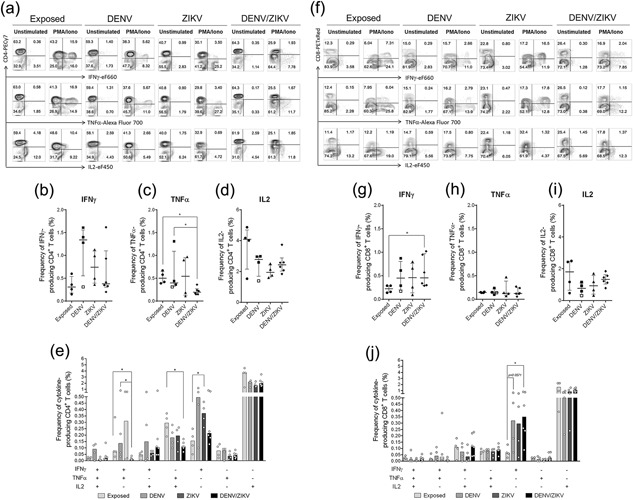
Frequency of IFNγ‐, TNF‐, and IL2‐producing CD4+ and CD8+ T cells in acute DENV, ZIKV, and DENV/ZIKV‐patients and exposed donors. Cultures of 2 × 10⁵ PBMCs were stimulated with PMA/Ionomycin or unstimulated (medium) for 6 h in presence of brefeldin in the last 4 h. Then, cells were stained with mAb against surface markers CD3, CD8, CD4, and mAb against intracellular IFNγ, TNF, and IL2. Frequency of IFNγ, TNF, and IL2 on CD4+ (a) and CD8+ T cells (f) was exhibited in counter plots from one representative exposed donor, DENV‐, ZIKV, and DENV/ZIKV‐patients by flow cytometry for both conditions. Frequency, median, 25th and 75th percentile of IFNγ+ (b), TNF+ (c), and IL2+ (d) CD4+ T cells in unstimulated condition from acute viral patients were compared between them and with those in exposed healthy controls. The same strategy was used (g–i). Patient 2 in late‐acute phase (22 days of illness) was show as open squares. Bars represent the median of frequency of CD4+ T cells (e) and CD8+ T cells (j) expressing each of the seven possible combinations of IFNγ, TNF, and IL2 among the studied groups in unstimulated condition. Statistical significance of differences between groups and comparisons among the multifunctional populations were determined by using two‐tailed Mann–Whitney test and represented by lines. Values of p < 0.05 were considered significant (*p < 0.05; **p < 0.01).