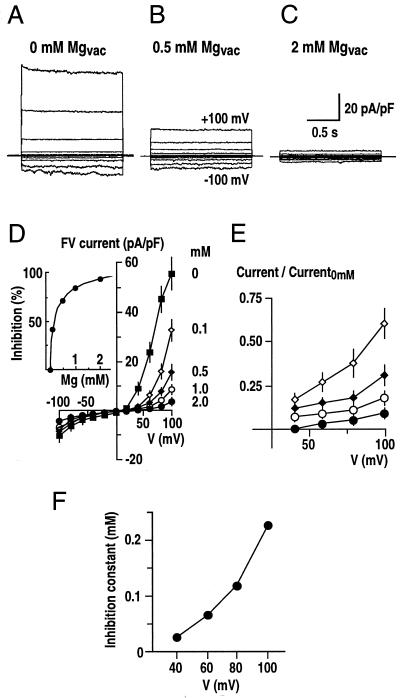
Figure 1.
Fast-activating vacuolar currents inhibited by vacuolar Mg2+ in fava bean guard cells. A through C, Three representative whole-vacuole recordings are shown at Mg2+ concentrations of 0 mm (A), 0.5 mm (B), and 2 mm (C) in the pipette (luminal) solution. Membrane potential was stepped from −100 to +100 mV in 20-mV increments from a holding potential of 0 mV. In all traces, the vacuolar ion currents have been normalized to the whole-vacuolar capacitance (pA/pF). The solutions for FV current measurement contained 100 mm KCl, 4 mm EGTA, 10 mm HEPES-Tris, pH 7.5, in the bathing medium (cytosolic side), and 100 mm KCl, 5 mm CaCl2, 5 mm MES-Tris, pH 5.5, with varied MgCl2 of 0 to 2 mm in the pipette (vacuolar side). D, Average current-voltage relationships from experiments performed as in A through C at Mg2+ concentrations of 0, 0.1, 0.5, 1.0, and 2.0 mm in the pipette solution. FV currents were measured as the instantaneous component of whole-vacuole currents (n = 3–5 vacuoles per Mg2+ concentration; whole-vacuole capacitance = 9.7 ± 3.4 pF). Inset, Average percentage of inhibition of SV currents at +100 mV is plotted as a function of the concentrations of vacuolar Mg2+ and fitted to a Hill equation. E, Voltage dependence of vacuolar Mg2+ block. Average whole-vacuole currents in the presence of vacuolar Mg2+ as in D were normalized to currents in the absence of Mg2+ (Current0 mm). Symbols are as in D. F, Mg2+ inhibition constant (Ki) plotted as a function of the applied membrane potentials. Inhibition constants at +40 to +100 mV were obtained using the Hill equation (see “Materials and Methods”).

