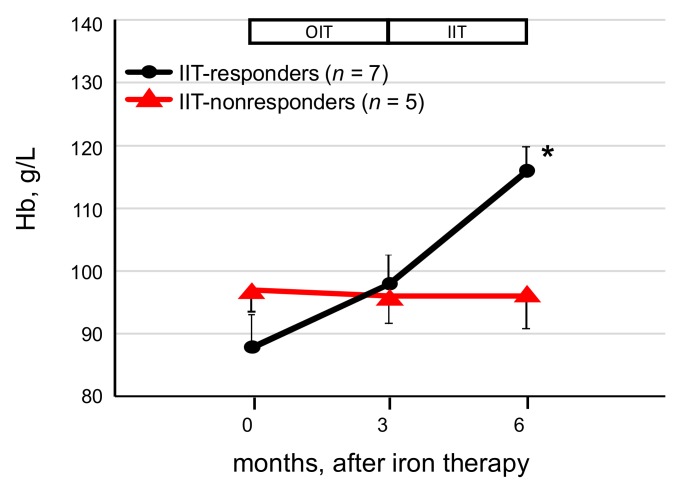
Figure 3.
Change of Hb levels in IIT group before and after IIT. Of the 12 OIT-nonresponders, the levels of Hb were significantly increased in seven (58.3%) of the 12 patients at the end of the study, whereas the Hb levels remained unchanged in the five IIT-nonresponders. Data are expressed as mean ± SEM. Comparison of two nonparametric data groups was analyzed by the Mann–Whitney U test. * p < 0.01, vs. IIT-nonresponders.

