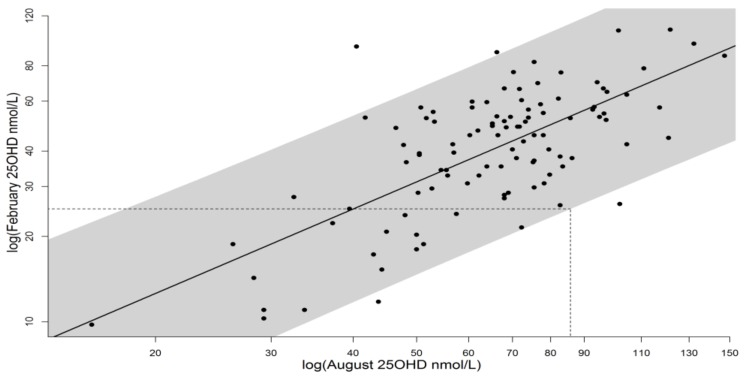
Figure 1.
Log-log regression of February 25(OH)D on August 25(OH)D, as described in [13], data from [10,14]. Data points are individual volunteers, shaded band shows 96% prediction interval, under which 97.5% of individuals would exceed 25 nmol/L in February given an August level of 85.8 nmol/L. White Caucasian vitamin D spend data have been used as a proxy for South Asian vitamin D spend as explained in Section 3.1.

