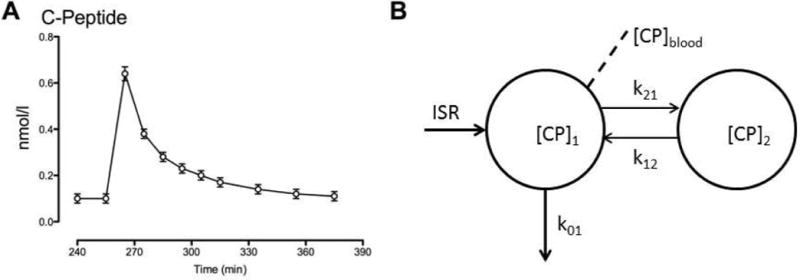
Fig. 1.

C-peptide concentrations after bolus injection in the presence of somatostatin to block endogenous insulin (and C-peptide) secretion (Panel A). Kinetics of C-peptide (Panel B) where [CP]1 and [CP]2 are C-peptide concentrations in the accessible and peripheral compartments respectively; k01, k12, k21 are kinetic parameters while ISR represents the insulin secretion rate and [CP]blood is the C-peptide concentration sampled from the peripheral circulation.
