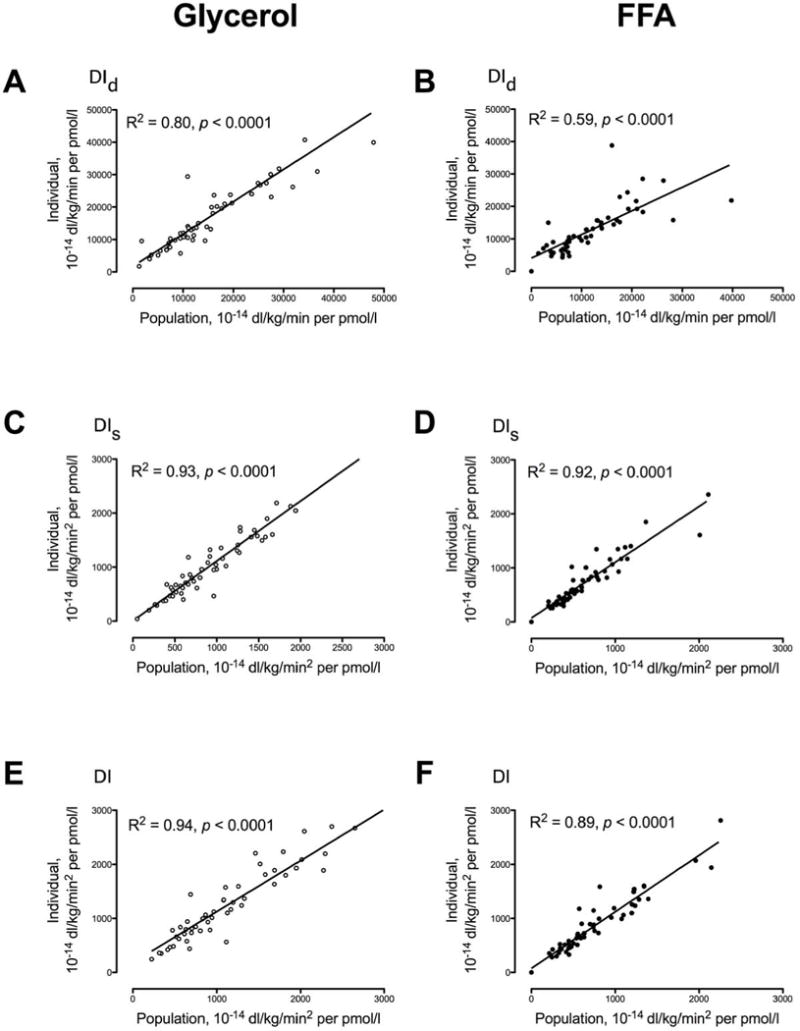
Fig. 3.

Relationship of DId (Panels A and B), DIs (Panels C and D) and DI (Panels E and F) calculated using anthropometric characteristics (Population) versus those calculated from experimental data for C-peptide kinetics (Individual) for each subject (open circles) in response to a 1g/Kg body weight glucose challenge with accompanying glycerol infusion or during an identical glucose challenge with free fatty acid (FFA) elevation (solid circles).
