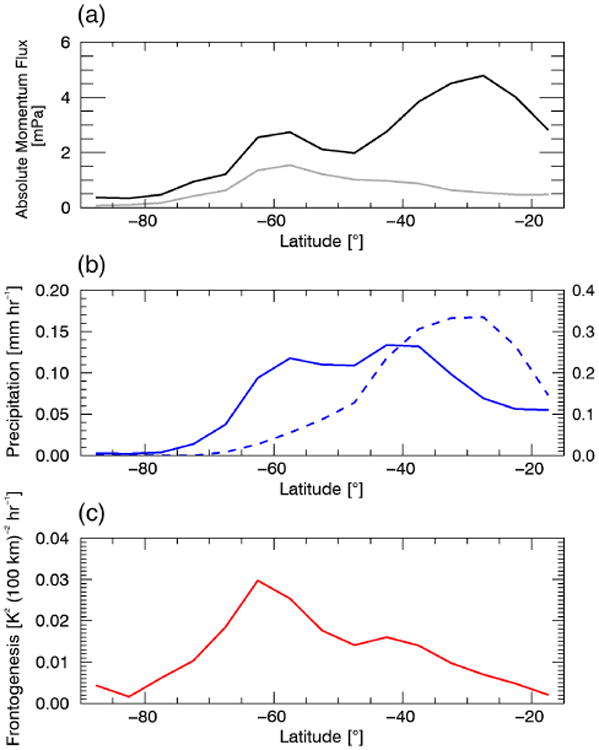
Figure 14.

NR JJA average, zonal mean (a) non-orographic absolute gravity wave momentum flux at ∼15 km (black) and ∼20 km (grey), (b) precipitation rate, and (c) the frontogenesis function. The dashed contour in (b) indicates the percentage of time that the precipitation rate exceeds 10 mm h−1, using the axis on the right. [Colour figure can be viewed at wileyonlinelibrary.com].
