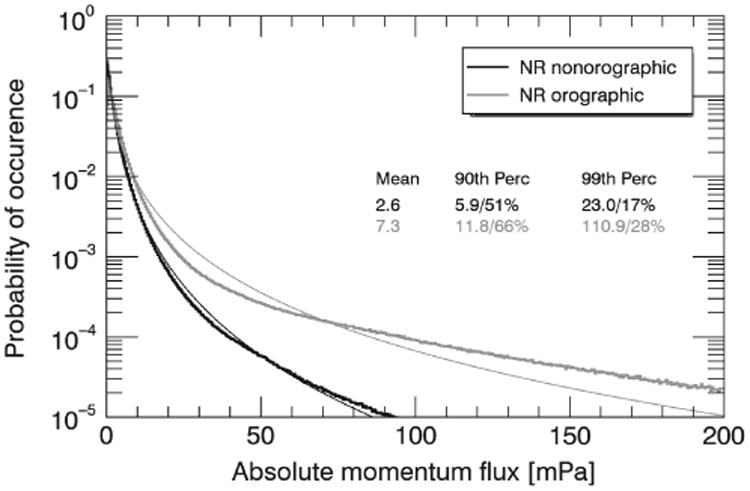
Figure 16.

NR JJA PDFs of absolute momentum flux for nonorographic regions (black) and orographic regions (grey). The thin solid lines show the theoretical log-normal distributions with the same mean and standard deviation as the modelled PDFs. Also shown on the plot are the mean and the 90th and 99th percentile values for each region.
