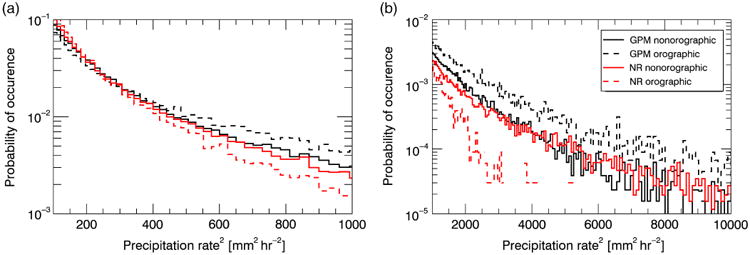
Figure 8.

July precipitation PDFs for the NR and GPM for both orographic and non-orographic regions between ∼ 65° S and 15°S for precipitation rates (a) between 10 and ∼31.6 mm h−1 and (b) between ∼31.6 and 100 mm h−1. GPM Ku near-surface precipitation rates for July 2014 and 2015 were used to calculate the GPM PDFs. NR July 2015 surface precipitation rates were used to calculate the NR PDFs. Orographic and non-orographic are defined in Figure 9. [Colour figure can be viewed at wileyonlinelibrary.com].
