Figure 5.
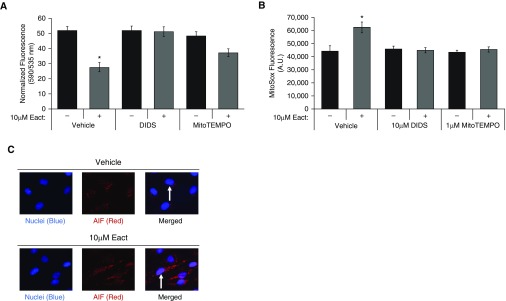
Ano1 activation results in loss of mitochondrial membrane potential (ΔΨm), increased mitochondrial reactive oxygen species, and apoptosis-inducing factor (AIF) nuclear translocation. (A) RLMVECs were pretreated with 10 μM DIDS, 100 nM SB203580, 1 μM MitoTEMPO, or vehicle for 1 hour. Cells were then treated with vehicle or 10 μM Eact for 20 minutes, followed by loading with 10 μM JC-1 dye for 10 minutes before measuring 535-nm (green monomers, depolarized mitochondria) and 590-nm (red aggregate, high ΔΨm) fluorescence. Data are presented as 590-/535-nm emission. (n = 5, ANOVA with Tukey multiple comparison, P < 0.05). (B) Cells were treated as in A and loaded with 5 μM MitoSOX for 10 minutes, followed by fluorescence measurement. (n = 5, ANOVA with Tukey multiple comparison, P < 0.05). (C) Immunofluorescence of AIF was assessed in RLMVECs treated with vehicle or 10 μM Eact for 24 hours (100×). Increased Eact-induced nuclear translocation highlighted with white arrows 100×, (n = 3). Data are presented as mean (±SEM). *P < 0.05 compared to vehicle control.

