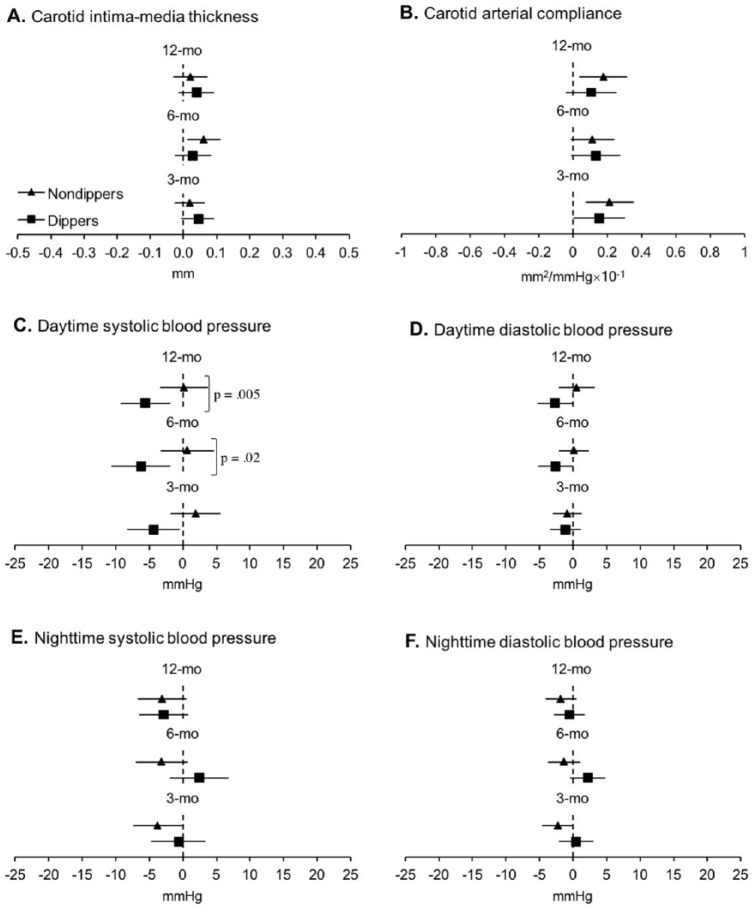
Figure 4.
Estimated mean changes in cardiovascular health from baseline.
Note. Solid triangles (nondippers) and squares (dippers) represent estimated group mean changes from baseline; bars represent associated 95% confidence intervals. Confidence intervals not including zero (i.e., not crossing the vertical dotted line) indicate significant differences from baseline (see Supplemental Table 1). The p value indicate significant differences between groups in estimated mean change from baseline adjusting for age, education, gender, presence of hypertension, and type 2 diabetes.

