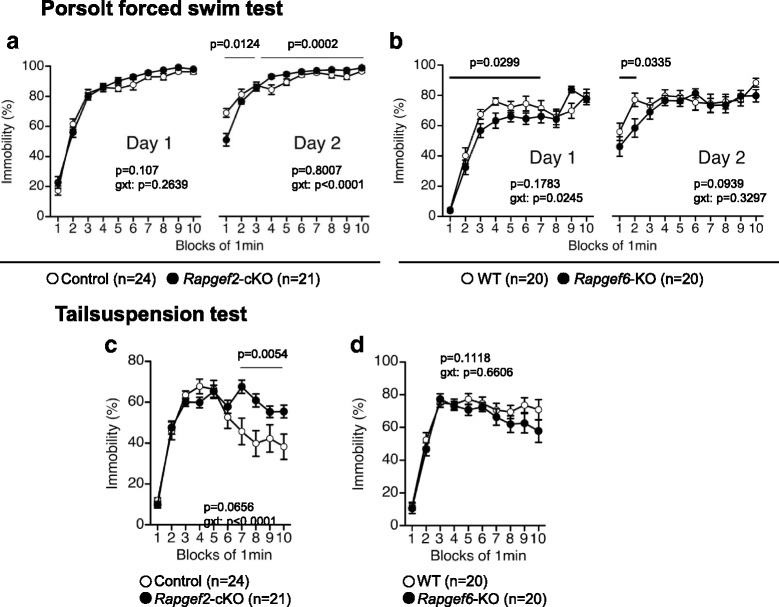
Fig. 3.

Assessment of depression-like behavior. a, b Porsolt forced swim test. Percentage in immobility at days 1 and 2 and p values for genotype × time interaction (g × t) are shown. c, d Tail suspension test. Percentages of immobility were determined. p value for genotype × time interaction (g × t) are shown
