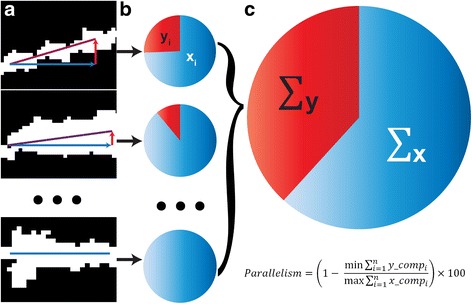
Fig. 3.

Method to quantify the overall parallelism of glial processes. a Binary high-magnification images of glial processes with increasing horizontal vector components (blue) compared to vertical (red). Resultant vector is the sum of these components (purple). b Individual pie charts depict the ratio of the length of the horizontal (blue, xi) and vertical (red, yi) components for each resultant vector. c The sum of the horizontal (x) and vertical (y) components for each nerve represents the degree of parallelism. The percent parallelism for each nerve is calculated from the ratio of the summed components following rotation to minimize vertical and maximize horizontal orientation. 100% corresponds to perfect parallelism and 0% corresponds to random orientation
