Figure 1.
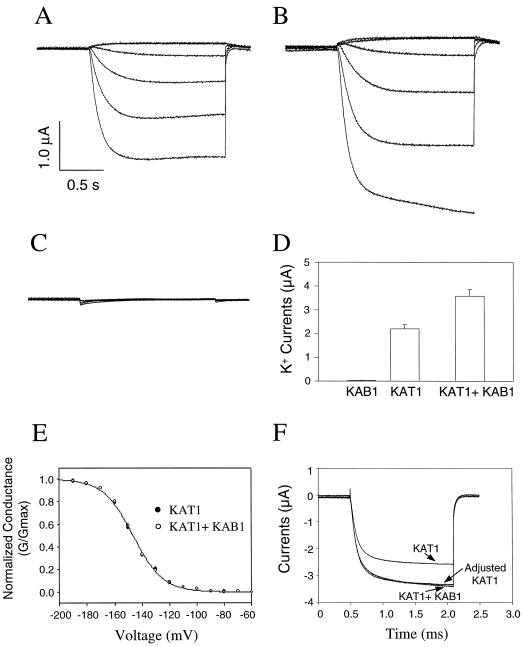
Analysis of KAB1 co-expression effects on KAT1 currents. Time-dependent K+ currents are shown for oocytes injected with approximately 10 μg of KAT1 cRNA (A), approximately 10 μg each of KAT1 and KAB1 cRNA (B), or water (C). During recordings shown in A, B, and C, the holding potential was −60 mV, the current was recorded at −160-, −120-, −80-, −40-, 0-, and +40-mV step voltages, and the current and time axes are indicated by vertical and horizontal bars, respectively. D, K+ currents (±se) recorded from oocytes (n ≥ 13 for each of the treatments shown) maintained at a holding potential of −60 mV during a step voltage to −160 mV. Pooled data are presented for recordings of K+ currents from oocytes injected with either KAB1 (alone), KAT1 (alone), or KAT1 and KAB1 (together) cRNA. E, G/Gmax at varying command potentials for K+ currrents recorded from oocytes injected with KAT1 cRNA or with KAT1 and KAB1 cRNA. In many cases, the data points for the two treatments overlap; only one data point is visible at many of the step voltages. F, Time-dependent currents (−60-mV holding potential, −160-mV step voltage). Data for KAT1 alone and in the presence of KAB1 are shown, along with a superimposition of the two currents by adjusting the KAT1 data.

