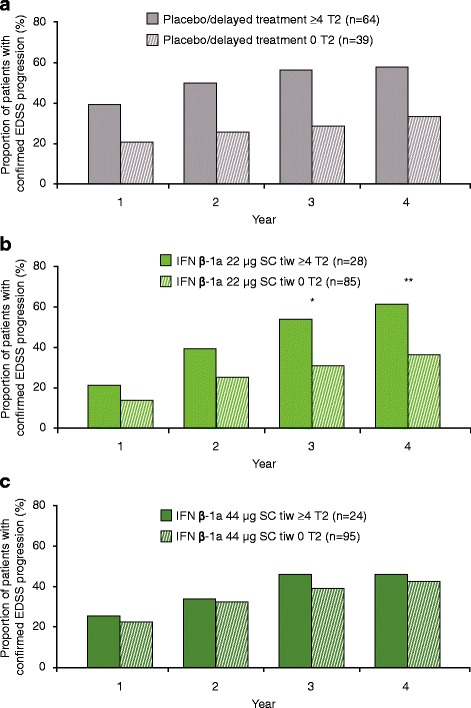
Fig. 1.

Proportion progressed at each year by ≥4 versus 0 active T2 lesions at 6 months. a Placebo/delayed treatment, ≥4 versus 0 T2 lesions at 6 months; b IFN β-1a 22 μg SC tiw, ≥4 versus 0 T2 lesions at 6 months; c IFN β-1a 44 μg SC tiw, ≥4 versus 0 T2 lesions at 6 months. p values indicate differences between patients with differing lesion loads at 6 months within the treatment group. No statistically significant differences were seen in the placebo/delayed treatment or IFN β-1a 44 μg SC tiw group. Values were calculated with a logistic regression model with predictor (≥4 vs. 0 T2 lesions) as a fixed effect; number of relapses within the previous 2 years, age, baseline EDSS score, and baseline burden of disease were independent variables, and p values were calculated for the predictive effect of T2 lesion subgroups. *p < 0.05; **p < 0.01. EDSS: Expanded Disability Status Scale; IFN β-1a: interferon beta-1a; SC: subcutaneously; tiw: three times weekly
