
Fig. 1.
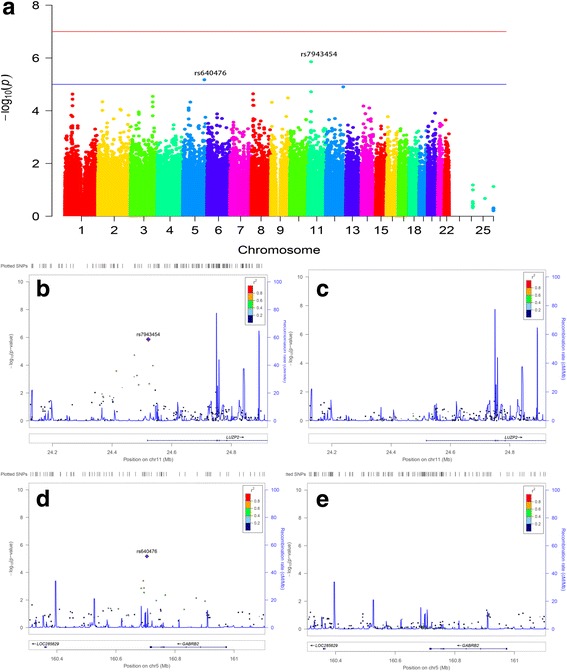
Manhattan and regional plots for associations with plasma NFL levels. a Genome-wide signal intensity (Manhattan) plots showing the –log10 (p-value) for individual SNPs. b Regional association results for the 24.2 Mb to 24.8 Mb region of chromosome 11. c Association results for 24.2 Mb to 24.8 Mb region of chromosome 11 controlling for rs7943454. d Regional association results for the 160.4 Mb to 161 Mb regions of chromosome 5. e Association results for 160.4 Mb to 161 Mb regions of chromosome 5 controlling for rs640476