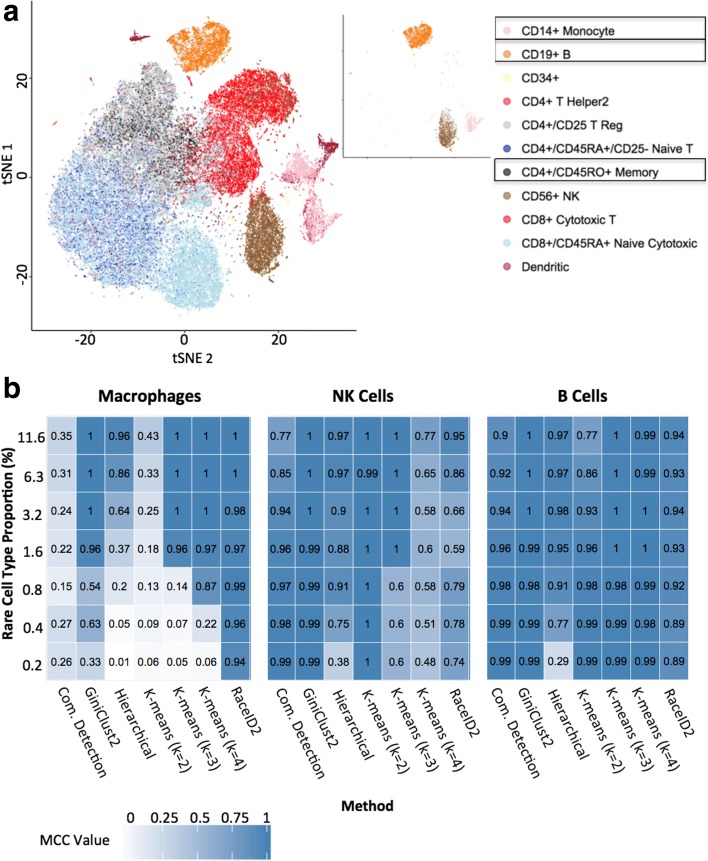
Fig. 3.
Analysis of the 68 k PBMC dataset [17]. a A visualization of reference labels for the full data set (left), along with the three cell subtypes selected for detailed analysis (right). b Comparison of the performance of different clustering methods, quantified by a Matthews correlation coefficient (MCC) [18] for each of the three cell subtypes

