
Fig. 1.
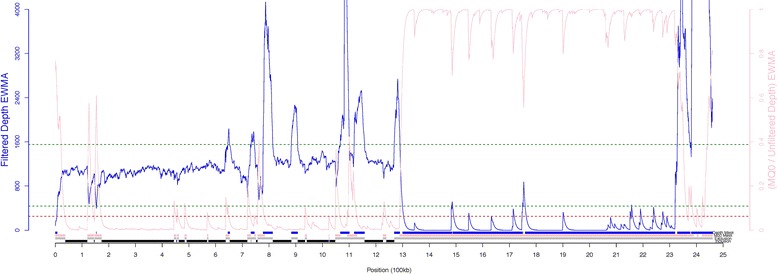
Regional callability mask to identify regions suitable for variant calling Exponentially weighted moving averages (EWMA) of read depth (blue line) and the mq0/unfiltered depth ratio (pink line) are plotted along the Y-chromosome sequence (KP081776.1). The dashed lines represent maximum and minimum thresholds for filtered depth (green) and a maximum threshold for the mq0 ratio (red). Colored bars below the plot indicate regions masked by the depth filter (blue), masked by the mq0 ratio filter (pink), excluded from the analysis (grey), and included (black) prior to site-level filtering