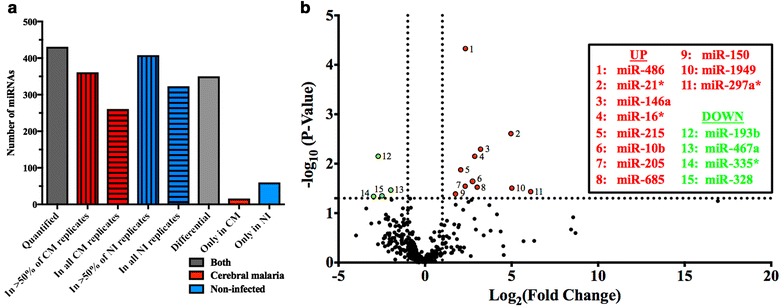
Fig. 2.

Detectable miRNA profiles in MV from NI compared with CM CBA mice. a The number of miRNA quantified in one or more biological group, and in > 50 or 100% of replicates in each biological group are shown. miRNA present in > 50% of replicates are further separated into groups of those common to both biological groups (further examined in Fig. 1b) and those expressed in one biological group only. b The volcano plot displays miRNA present in both biological groups; for each miRNA, the fold change (log2FC) and the significance (− log10P-value) are reported. P values were obtained with a student’s t test, with fewer assumptions. Horizontal threshold line: P = 0.05, a higher value indicates greater significance; vertical threshold lines: fold change = − 2 (left) and 2 (right). Highlighted in red are miRNA that are significantly increased in abundance in CM conditions, and in green, decreased
