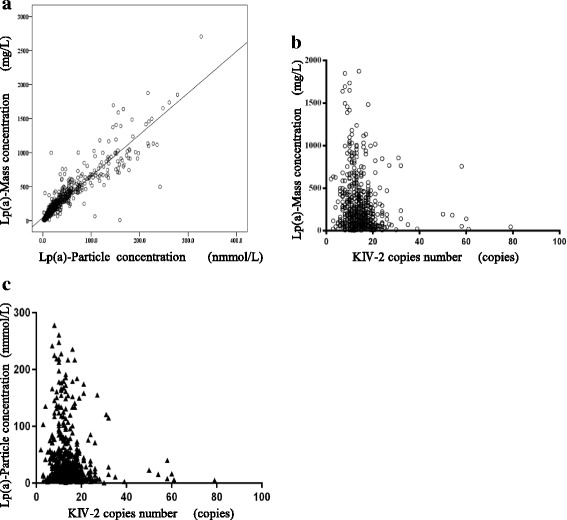
Fig. 1.

a Shows an XY scatter plot of Lp(a) mass and particle concentration, and the linear relationship with a regression equation: YLp(a)-mass = 6.565XLp(a)-particle, R2 = 0.852, P < 0.001. b Shows an XY scatter plot of KIV-2 copy number and Lp(a) mass concentration for all participants. The abscissa is KIV-2 copy number, and the left ordinate is Lp(a) mass concentration. c Shows KIV-2 copy number and Lp(a) particle concentration. The abscissa is KIV-2 copy number, and the left ordinate (right axis) is Lp(a) particle concentration. There is a negative correlation between Lp(a) level and KIV-2 copy number, i.e., the smaller the KIV-2 copy number the higher the Lp(a) concentration
