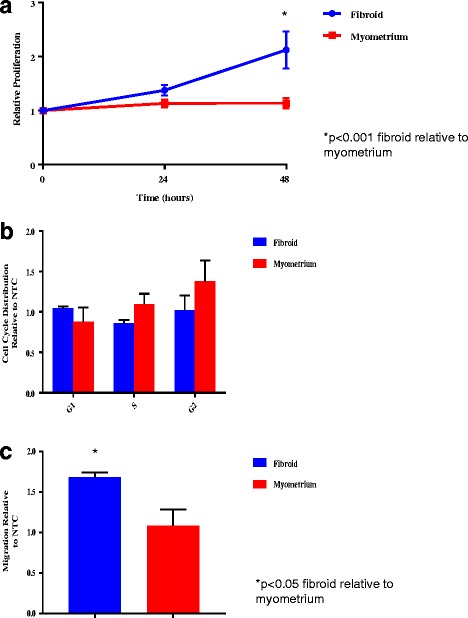
Fig. 4.

Cell proliferation, cell cycle analysis and relative migration. Results are presented with fibroid and myometrial cells normalized to NTC as the reference. P-value < 0.05 is indicated by an asterisk. a Proliferation Assay. Cell proliferation at 24 and 48 h time points after plating in fibroid compared to myometrial cells upregulated with miR-21. Average cell proliferation by time point is presented as mean ± SEM of three independent experiments from each of three independent infections. b Cell Cycle Analysis. Cell cycle analysis of fibroid compared to myometrial cells upregulated with miR-21. Transition through the cell cycle (G1, S, G2) is presented as mean ± SEM of three independent experiments. c Migration Assay. Relative migration of miR-21 upregulated fibroid compared to myometrial cells. Relative migration by time point is presented as mean ± SEM of each of three independent infections of both fibroid and myometrium
