
Fig. 3.
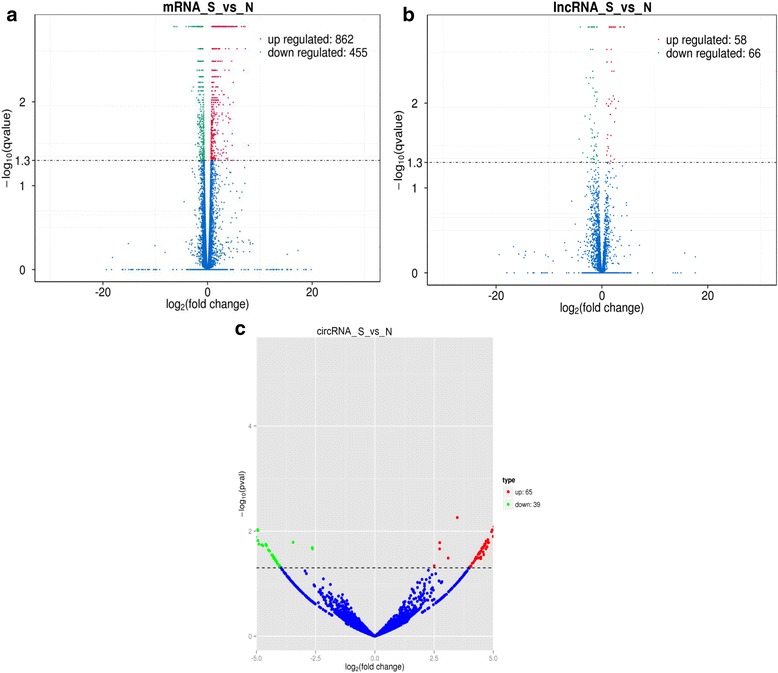
Differentially expressed mRNAs (a), lncRNAs (b) and circRNAs (c) in the two groups. Volcano plot of the p-values as a function of fold-change for mRNAs, lncRNAs and circRNAs indicate the dysregulated genes in the three normal and three infected tissues. Blue dots represent RNAs not significantly differentially expressed (p-value > 0.05) and the other dots represent RNAs differentially expressed (p-value < 0.05). Up-regulated RNAs were presented as red dots and down-regulated RNAs were presented as green dots