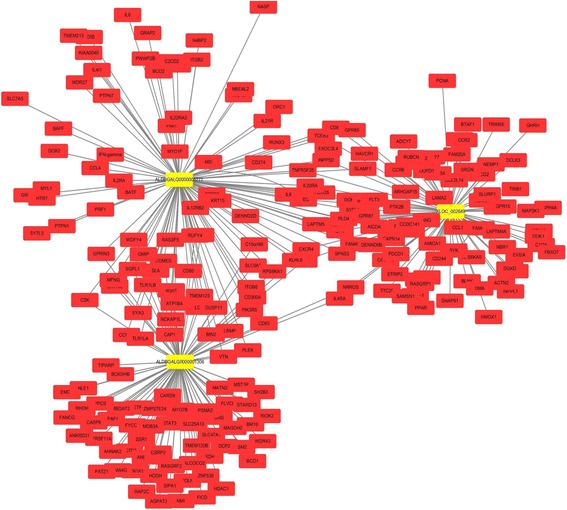
Fig. 7.

Co-expression network of the representative lncRNAs and their partial target mRNAs. The relationships of mRNA-lncRNA were re-constructed based on the expression correlation coefficients (Pearson correlation > 0.95 or < − 0.95) using the cytoscape software (v3.6.0). Different colors were used to show different genes, with yellow for lncRNAs and red for mRNAs
