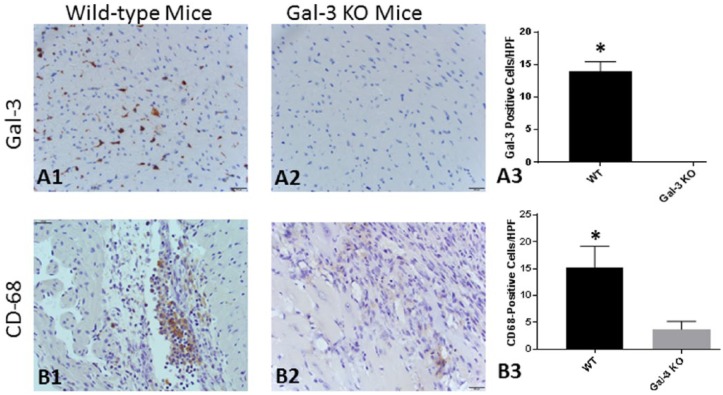
Figure 2.
Post-MI myocardial galectin-3 expression and macrophage infiltration 1 week after LAD ligation. Wild-type mice showed scattered areas of galectin-3 positivity (Panel A1), which was absent in the myocardial sections obtained from galectin-3 KO mice (Panel A2). Panel A3 represents isotype control for galectin-3 antibody. Panel A4 represents quantitative analysis of Panels A1 and A2 (7 myocardial fields, each group). The macrophage-specific F4/80 staining in WT mice showed abundant positively stained cells in the infarct (red arrow) and peri-infarct (blue arrow) regions, especially in the areas of excess cardiomyocyte loss (Panel B1). The galectin-3 KO mice showed reduced F4/80 positive cellular infiltration compared with WT mice (Panel B2). Panel B3 represents isotype control for mouse F4/80 antibody. Panel B4 represents quantitative analysis of Panels B1 and B2 (12 myocardial fields, each group). KO indicates knock-out; LAD, left anterior descending; MI, myocardial infarction; WT, wild-type.
*P < .05.

