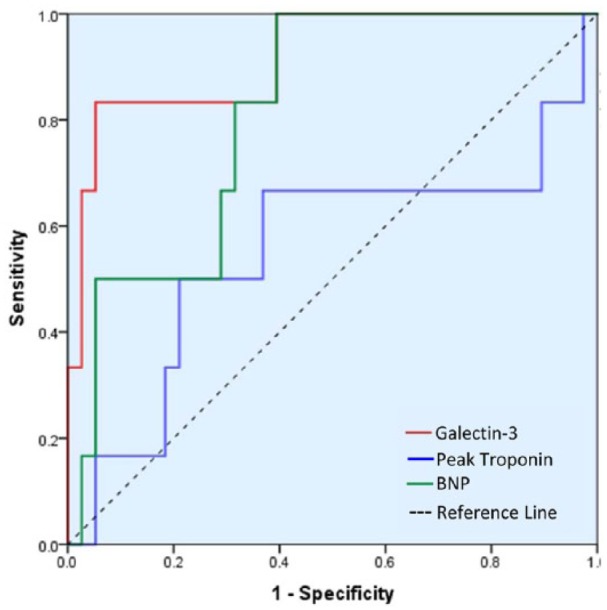
Figure 4.

Receiver-operating characteristic curve showing prediction of positive MACE outcome with galectin-3 compared with peak troponin and BNP. Area under the curve for galectin-3 is 0.914 (CI: 0.789-1.0; P < .05), BNP is 0.847 (CI: 0.709-0.985; P < .05), and peak troponin is 0.554 (CI: 0.258-0.851; P = .674). BNP indicates brain natriuretic peptide; CI, confidence interval; MACE, major adverse cardiovascular event.
