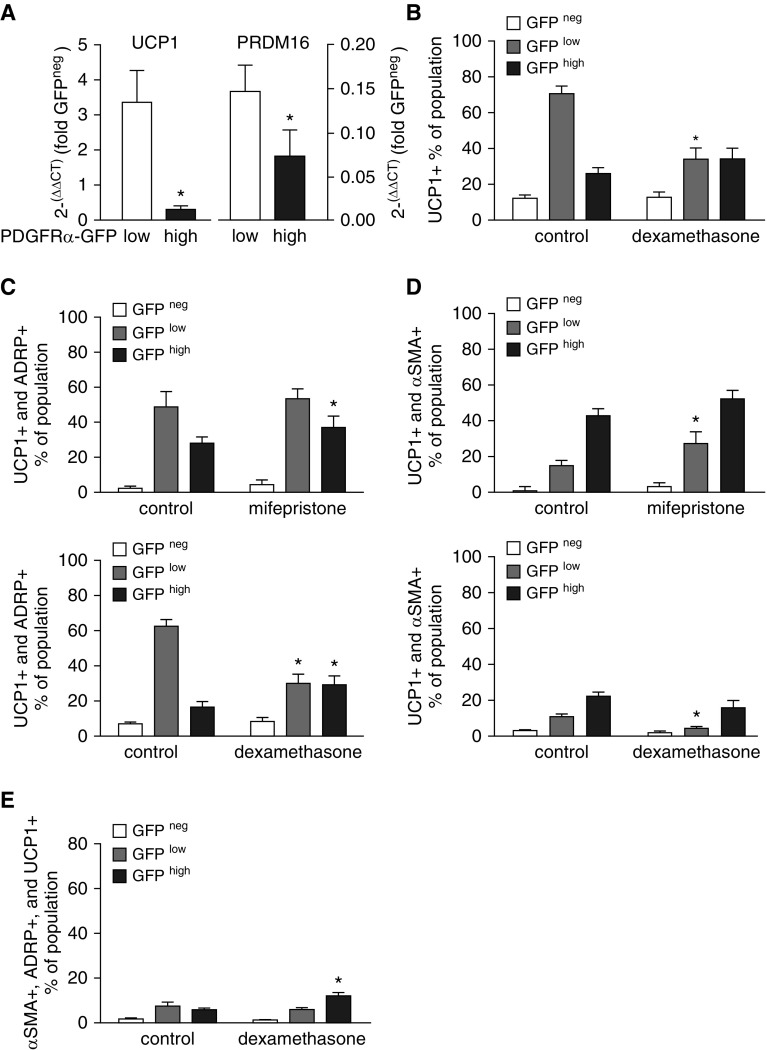
Figure 5.
GFPhigh fibroblasts that acquire more lipid droplets exhibit characteristics of brown adipocytes. (A) Fibroblasts were isolated from PDGFRα-GFP mice (control, not treated) and subjected to flow-cytometric sorting, gating on CD45− cells, and their GFP fluorescence intensity. Using quantitative RT-PCR, uncoupling protein-1 (UCP1, a marker of brown adipocytes) and PR domain containing 16 (Prdm16), mRNA from the GFPlow and GFPhigh populations was normalized to mRNA from the CD45−, GFP− population from the same fibroblast isolation. Mean ± SEM, n = 5 mice, all from separate litters. *P < 0.05 comparing GFPlow and GFPhigh. (B) Fibroblasts were isolated from mice treated with Dex during P1–P7 and subjected to flow cytometry after staining for UCP1, ADRP, and α-SMA. Mean ± SEM, n = 6 mice for each treatment group from 4 separate litters. *P < 0.05 for GFPhigh, comparing Dex-treated mice with untreated controls. (C) Dex and Mfp altered the proportions of fibroblasts that stained positively for ADRP as well as UCP1. Mean ± SEM, n = 5 mice for each treatment group from 4 separate litters. *P < 0.05 for GFPlow or GFPhigh, comparing Dex- or Mfp-treated mice with controls. (D) Dex and Mfp altered the proportions of fibroblasts that stained positively for both α-SMA and UCP1. Mean ± SEM, n = 5. Control and Mfp- or Dex-treated mice are the same as those shown in C. (E) Proportions of cells that stained positively for α-SMA, ADRP, and UCP1 within the GFP−, GFPlow, and GFPhigh populations in fibroblasts isolated from control and Dex-treated mice. Mean ± SEM, n = 5 using the same mice shown in D.

