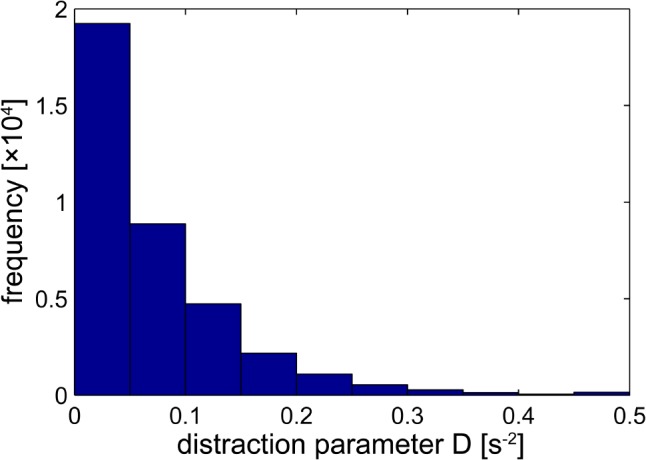
FIGURE 2.

Distribution of the distractor parameter D. For each volume in the functional magnetic resonance imaging (fMRI) time series D is calculated (using a 10-s sliding window) as the inverse of the product of response time and time between distractor presentations. 95% of the values fall below 0.2128.
