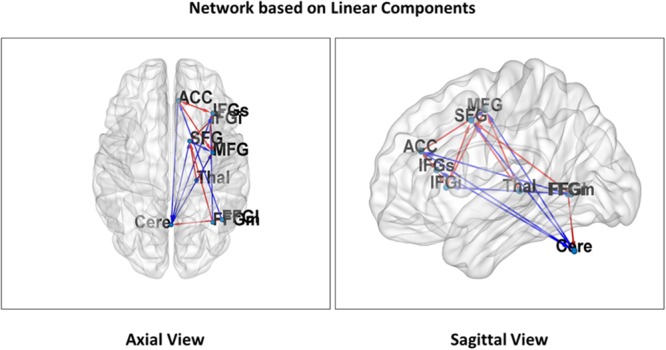
FIGURE 3.

Linear attentional networks. Nine regions of interest representing linear relationships in the executive centers of our attentional network are projected on both an axial (Left) and sagittal (Right) slice of the MNI reference (THAL, thalamus; SFG, superior frontal gyrus; IFGs, superior parts of the inferior frontal gyrus; IFGi, inferior parts of the inferior frontal gyrus; FFGl, lateral parts of the fusiform gyrus; FFGm, medial parts of the fusiform gyrus; CERE, Cerebellum; MFG, middle frontal gyrus; ACC, anterior cingulate cortex). The arrows visualize connections that showed a significant linear effect of the distraction parameter. Red arrows indicate a decrease and blue arrow an increase of connectivity with higher distraction. The hypothesized reduction of connectivity with increasing distraction is mainly found in frontal network areas whereas cerebellar connections show an increase. The latter finding may be due to increased motor-coordination as a result of increased stimulus/distraction-response events. In order to compare the intensity of activation over time, time-series data from nearest activation maxima in the normalized and smoothed functional images were extracted.
