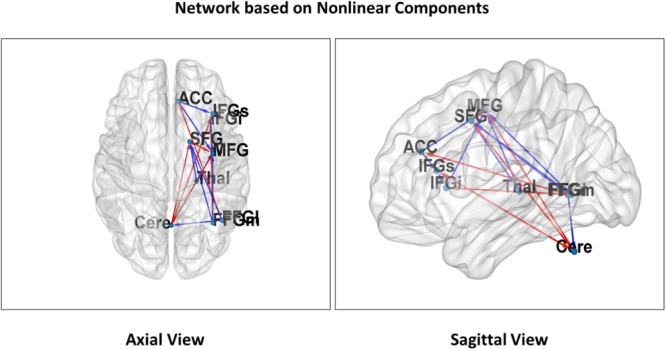
FIGURE 4.

Non-linear attentional networks. Nine regions of interest representing non-linear relationships in the attentional network are projected on both an axial (Left) and sagittal (Right) slice of the MNI reference. The arrows represent connections that showed a significant non-linear effect of the distraction parameter. Red arrows indicate a concave and blue arrow a convex relationship of connectivity with distraction. All connections are significant for both linear and non-linear coefficients and showed the opposite sign (see Figure 3 for labels).
