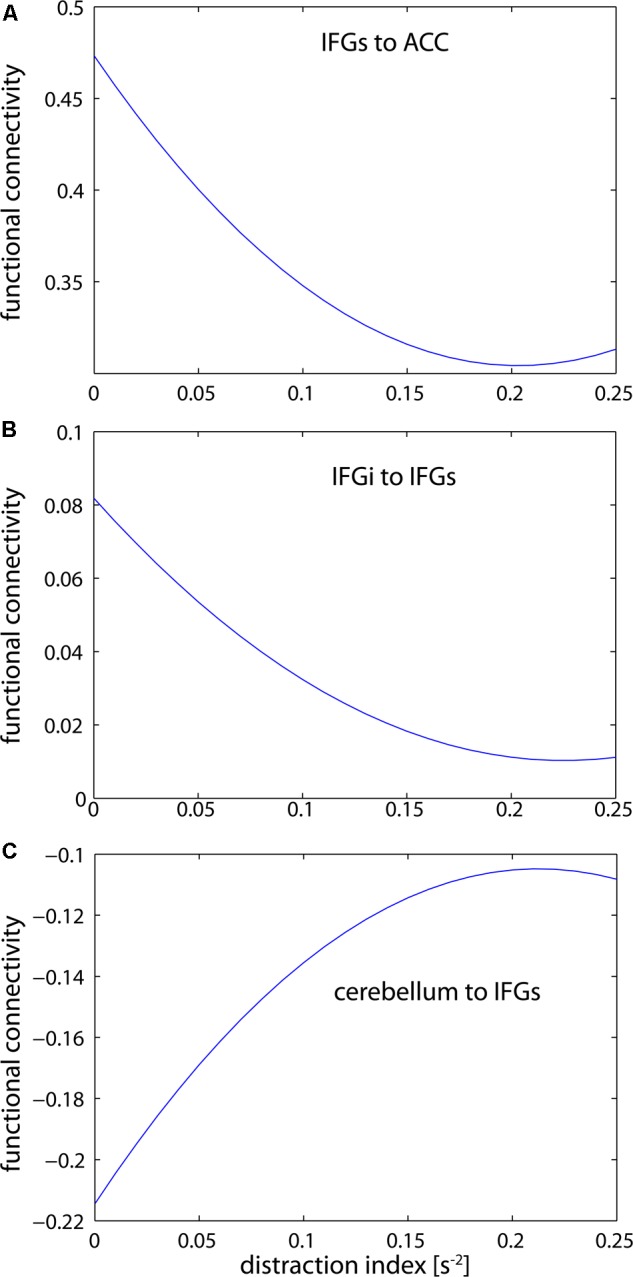
FIGURE 5.

Estimations of the distraction-connectivity function. Inter-frontal connectivity falls off but levels out with increasing distraction (A,B). In contrast, cerebellar-frontal connectivity increases but also reaches a maximum level (C). Interestingly, the connectivity estimate is negative in the latter path; thus the absolute correlation is also reduced with increasing distraction. (IFGs, superior parts of the inferior frontal gyrus; IFGi, inferior parts of the inferior frontal gyrus; CERE, cerebellum; ACC, anterior cingulate cortex).
