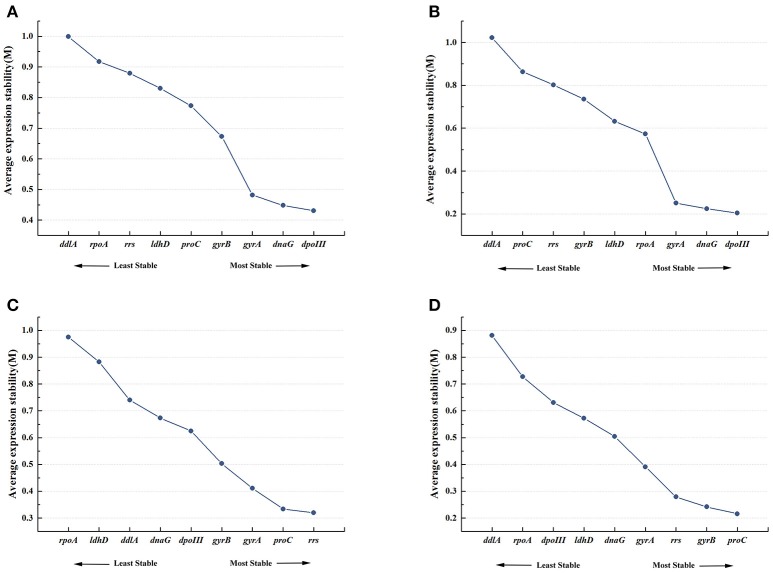
Figure 2.
Expression stability and ranking of nine candidate reference genes by geNorm. Average expression stability (M) was calculated following stepwise exclusion of the least stable gene across all treatment groups. (A) All samples. (B) 8% ethanol shock treatment (ST). (C) 12% ethanol ST. (D) 16% ethanol ST.

