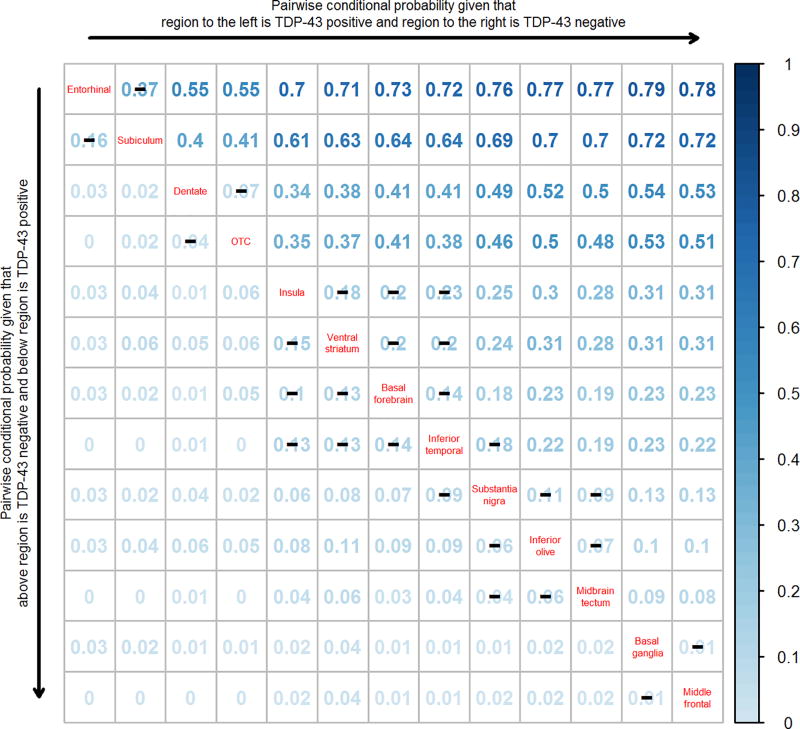
Figure 3.
A pairwise conditional probability matrix of the regions analyzed. Reading the plot from left to right, the conditional probability estimates show the estimated probability that the region on the left is TDP-43 positive before the region on the right. For example, the probability of entorhinal being TDP-43 positive given that subiculum is TDP-43 negative is 0.37. Reading the plot from top to bottom, the entries show the estimated probability that the region below is TDP-43 positive before the region above. For example, the probability of subiculum being TDP-43 positive given that entorhinal is negative is 0.16. Black lines (–) across conditional probability estimates indicate p-values are not statistically significant at the < 0.01 level. Note however, p-values between inferior temporal cortex and substantia nigra (p=0.01), between (insula, ventral striatum and basal forebrain) and substantia nigra (p<0.001), and between (insula, ventral striatum, basal forebrain, inferior temporal cortex) and (inferior olive and midbrain tectum (P<0.001). P-values were assessed using exact McNemar’s test.

