
Figure 5.
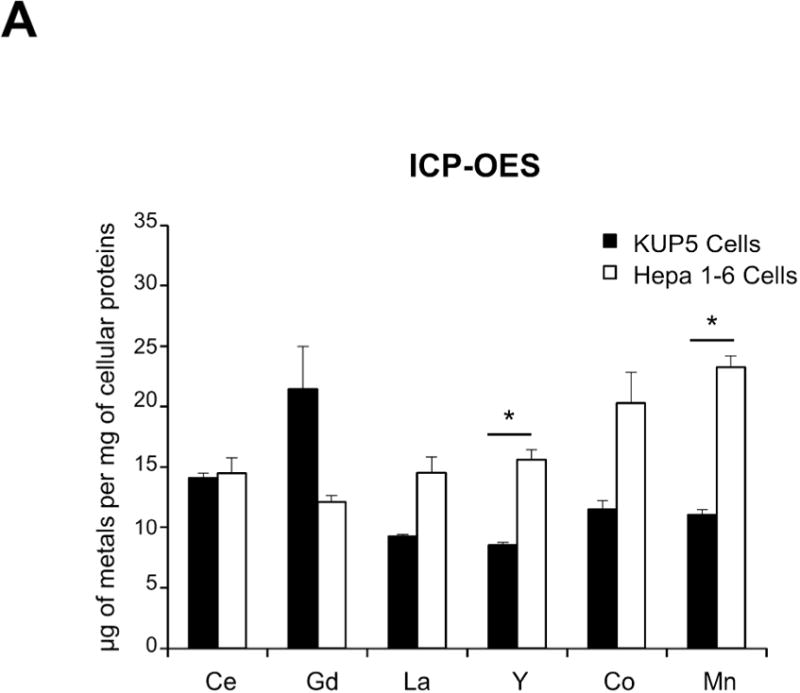
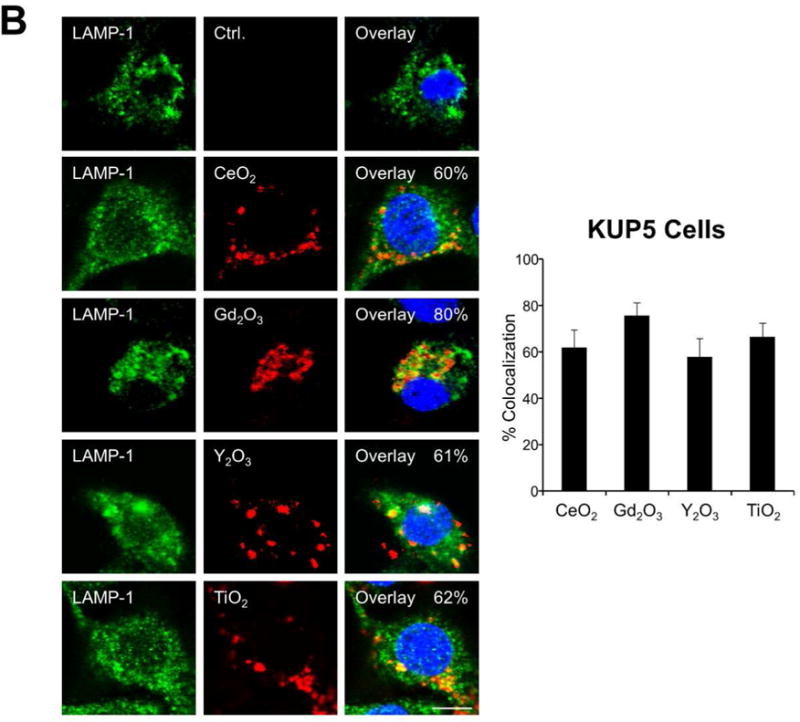
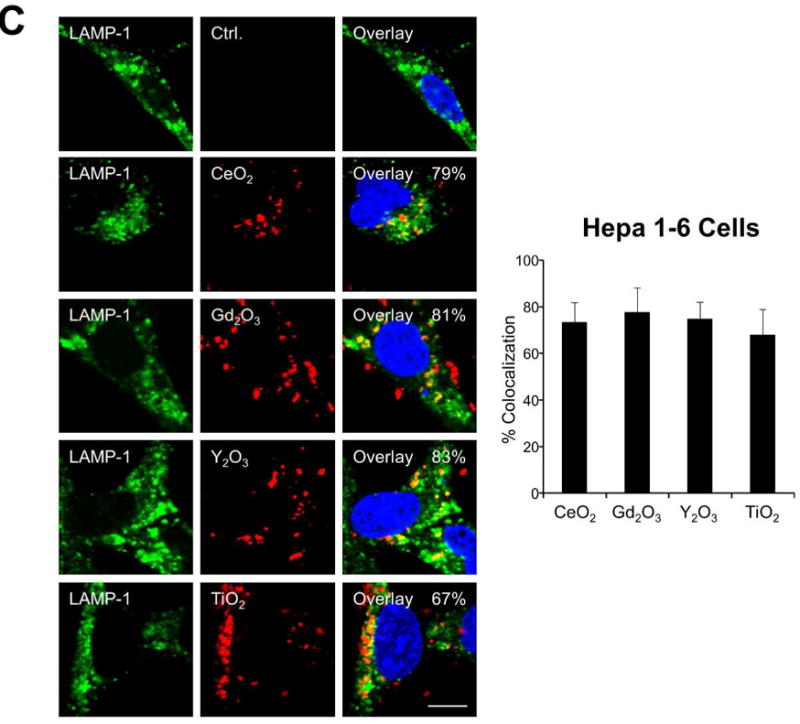
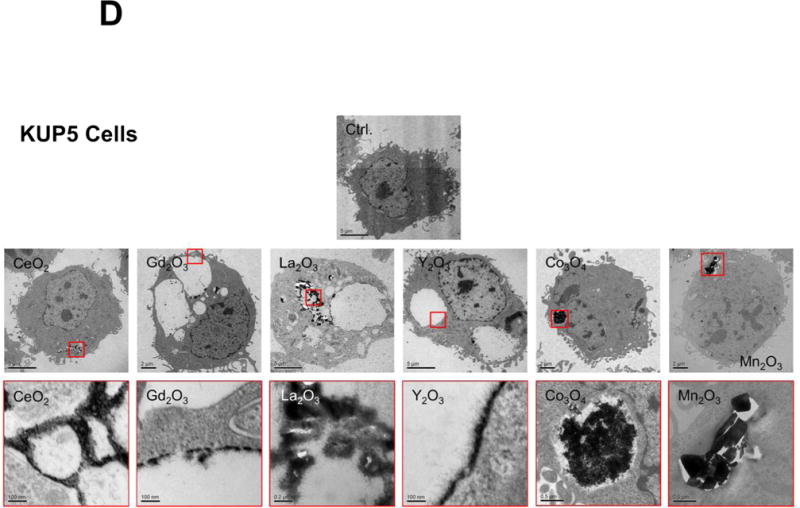
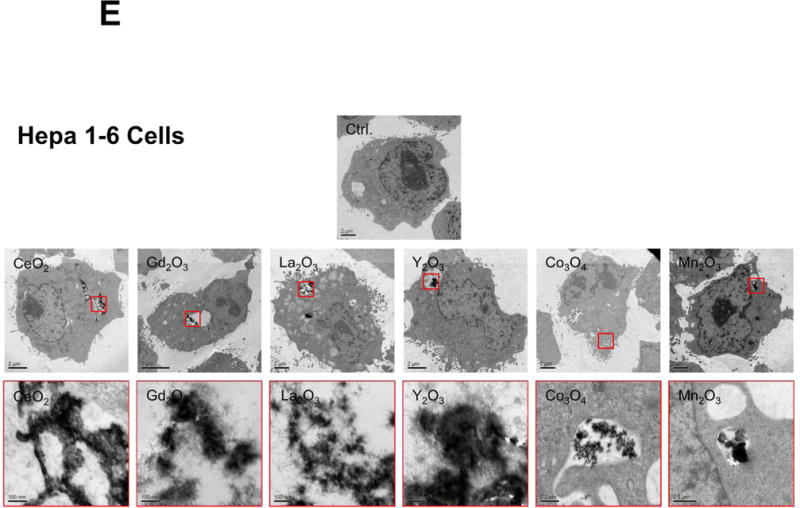
Cellular uptake and subcellular localization of MOx nanoparticles. (A) Use of ICP-OES to quantify MOx nanoparticle uptake in KUP5 and Hepa 1-6 cells. After 4 h of treatment with 12.5 μg/mL of the selected nanoparticles, KUP5 and Hepa 1-6 cell pellets were collected and acid digested for assessment of their metal content by ICP-OES. *p<0.05 compared to KUP5 cells. (B) and (C) show confocal microscopy to assess cellular uptake and intracellular localization in lysosomes (LAMP-1 staining). DyLight 594-labeled nanoparticles (12.5 μg/mL) were incubated with KUP5 (B) and Hepa 1-6 (C) cells for 2 and 6 h, respectively. Cells were fixed, permeabilized and stained with Alexa 488-labeled LAMP-1 antibody and Hoechst 33342 for labeling of the lysosomes and nucleus, respectively. Following image acquisition with a Confocal SP8-SMD microscope, the percentages of particles co-localizing with LAMP-1 were quantified with ImageJ software. The scale bar is 10 μm. (D) and (E) show TEM micrographs of KUP5 and Hepa 1-6 cells, respectively, after treatment with 25 μg/mL MOx nanoparticles for 2 h. The images in the upper and lower panel were captured at 6000-8000× and 100000-200000× magnifications, respectively. The scale bar for each TEM micrograph is embedded in the image. Please notice the intracellular biotransformation of REOs to urchin-shaped structures in both cell types.