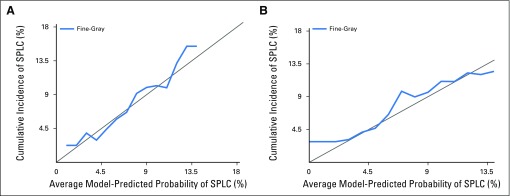
Fig A1.
Calibration plots. (A) The calibration on the entire data used to fit the model. (B) The validation of the prediction model using bootstrap cross-validation method. The x-axis shows the mean predicted probability of the conditional cumulative incidence model. The y-axis indicates marginal cumulative incidence probabilities for the respective cohorts. The gray line represents equality between the predicted and observed marginal cumulative incidences.

