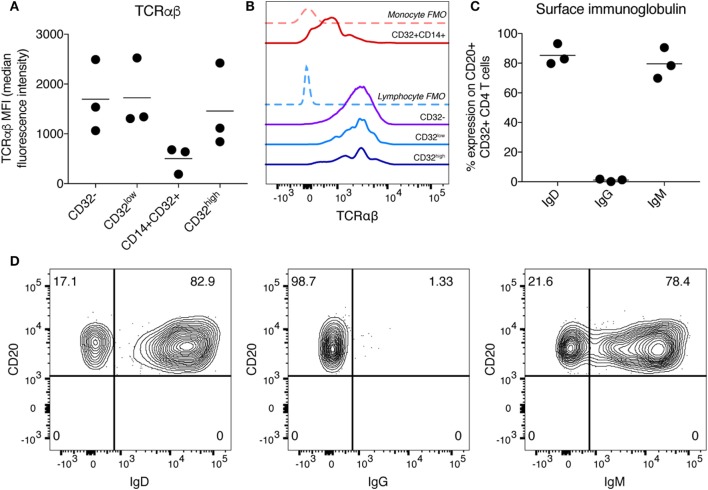
Figure 2.
Characterization of T cell receptor and immunoglobulin (Ig) expression on CD32highCD3+CD4+ T cells. (A) Expression of TCRαβ on CD32-expressing CD3+CD4+ T cell populations was measured by flow cytometry and is shown here as median fluorescence intensity. Bar is shown at the mean. (B) Histogram showing TCRαβ staining on CD32-expressing CD3+CD4+ T cell populations of one sample shown in panel (A). Fluorescence minus one (FMO) controls are shown as dashed lines and individual populations as solid lines. (C) Percentage expression of Ig was measured on CD3+CD4+CD32highCD20+ cells. Expression of IgD, IgG, and IgM is shown. Expression was measured by flow cytometry, and bar is shown at the mean. (D) Representative staining of data shown in panel (C).

